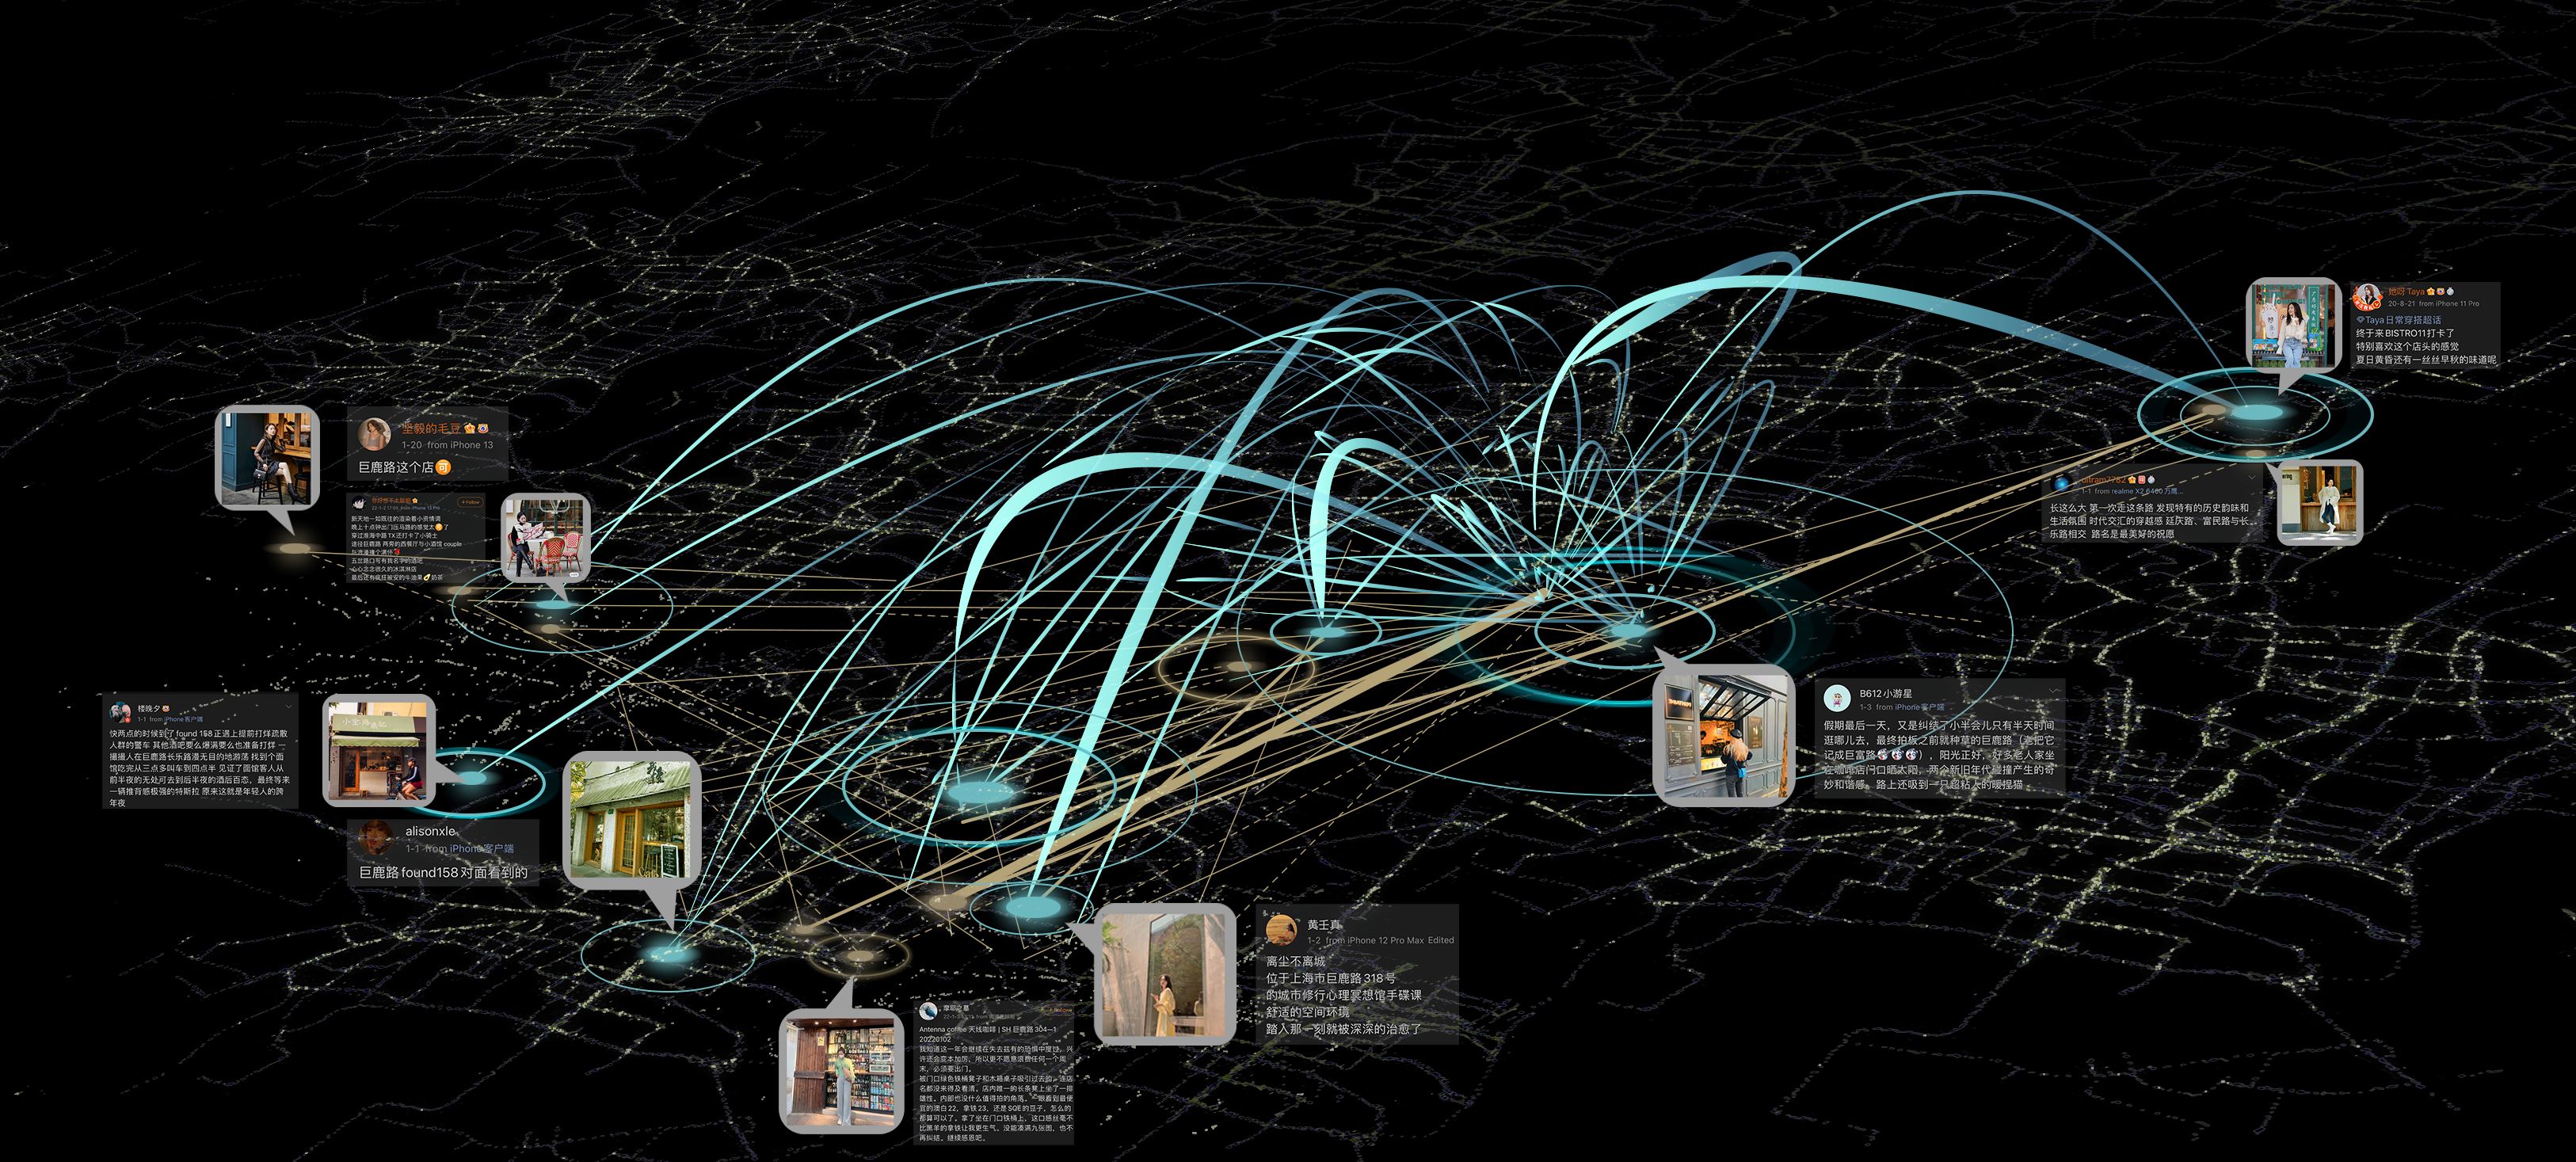
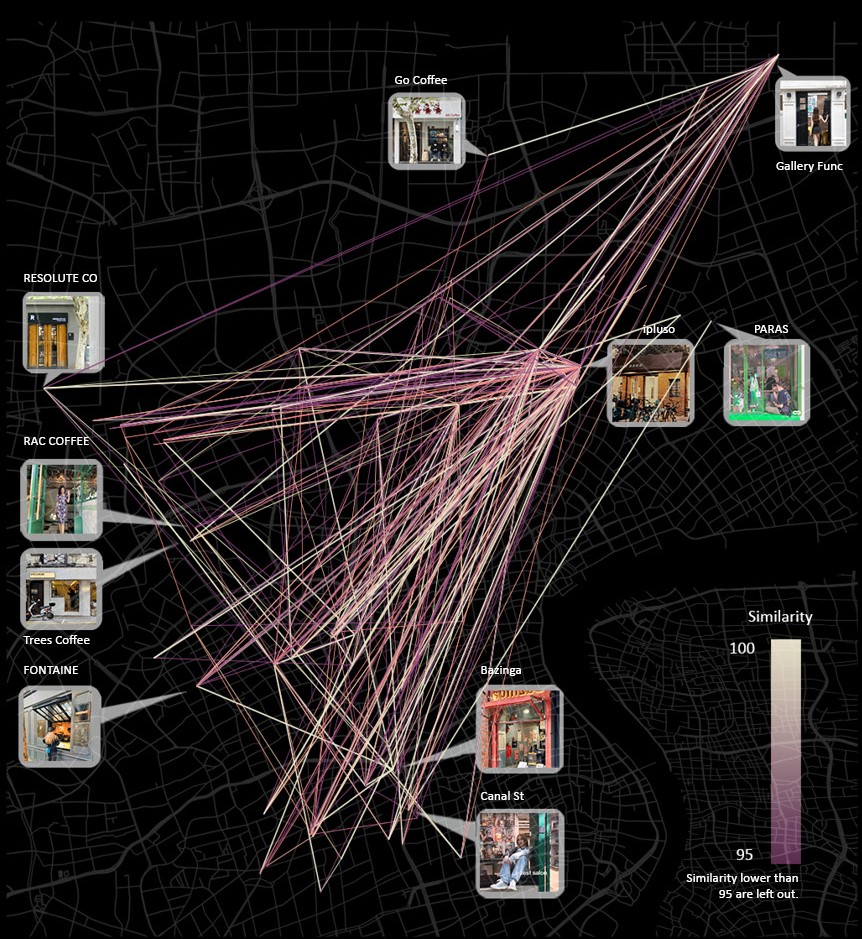
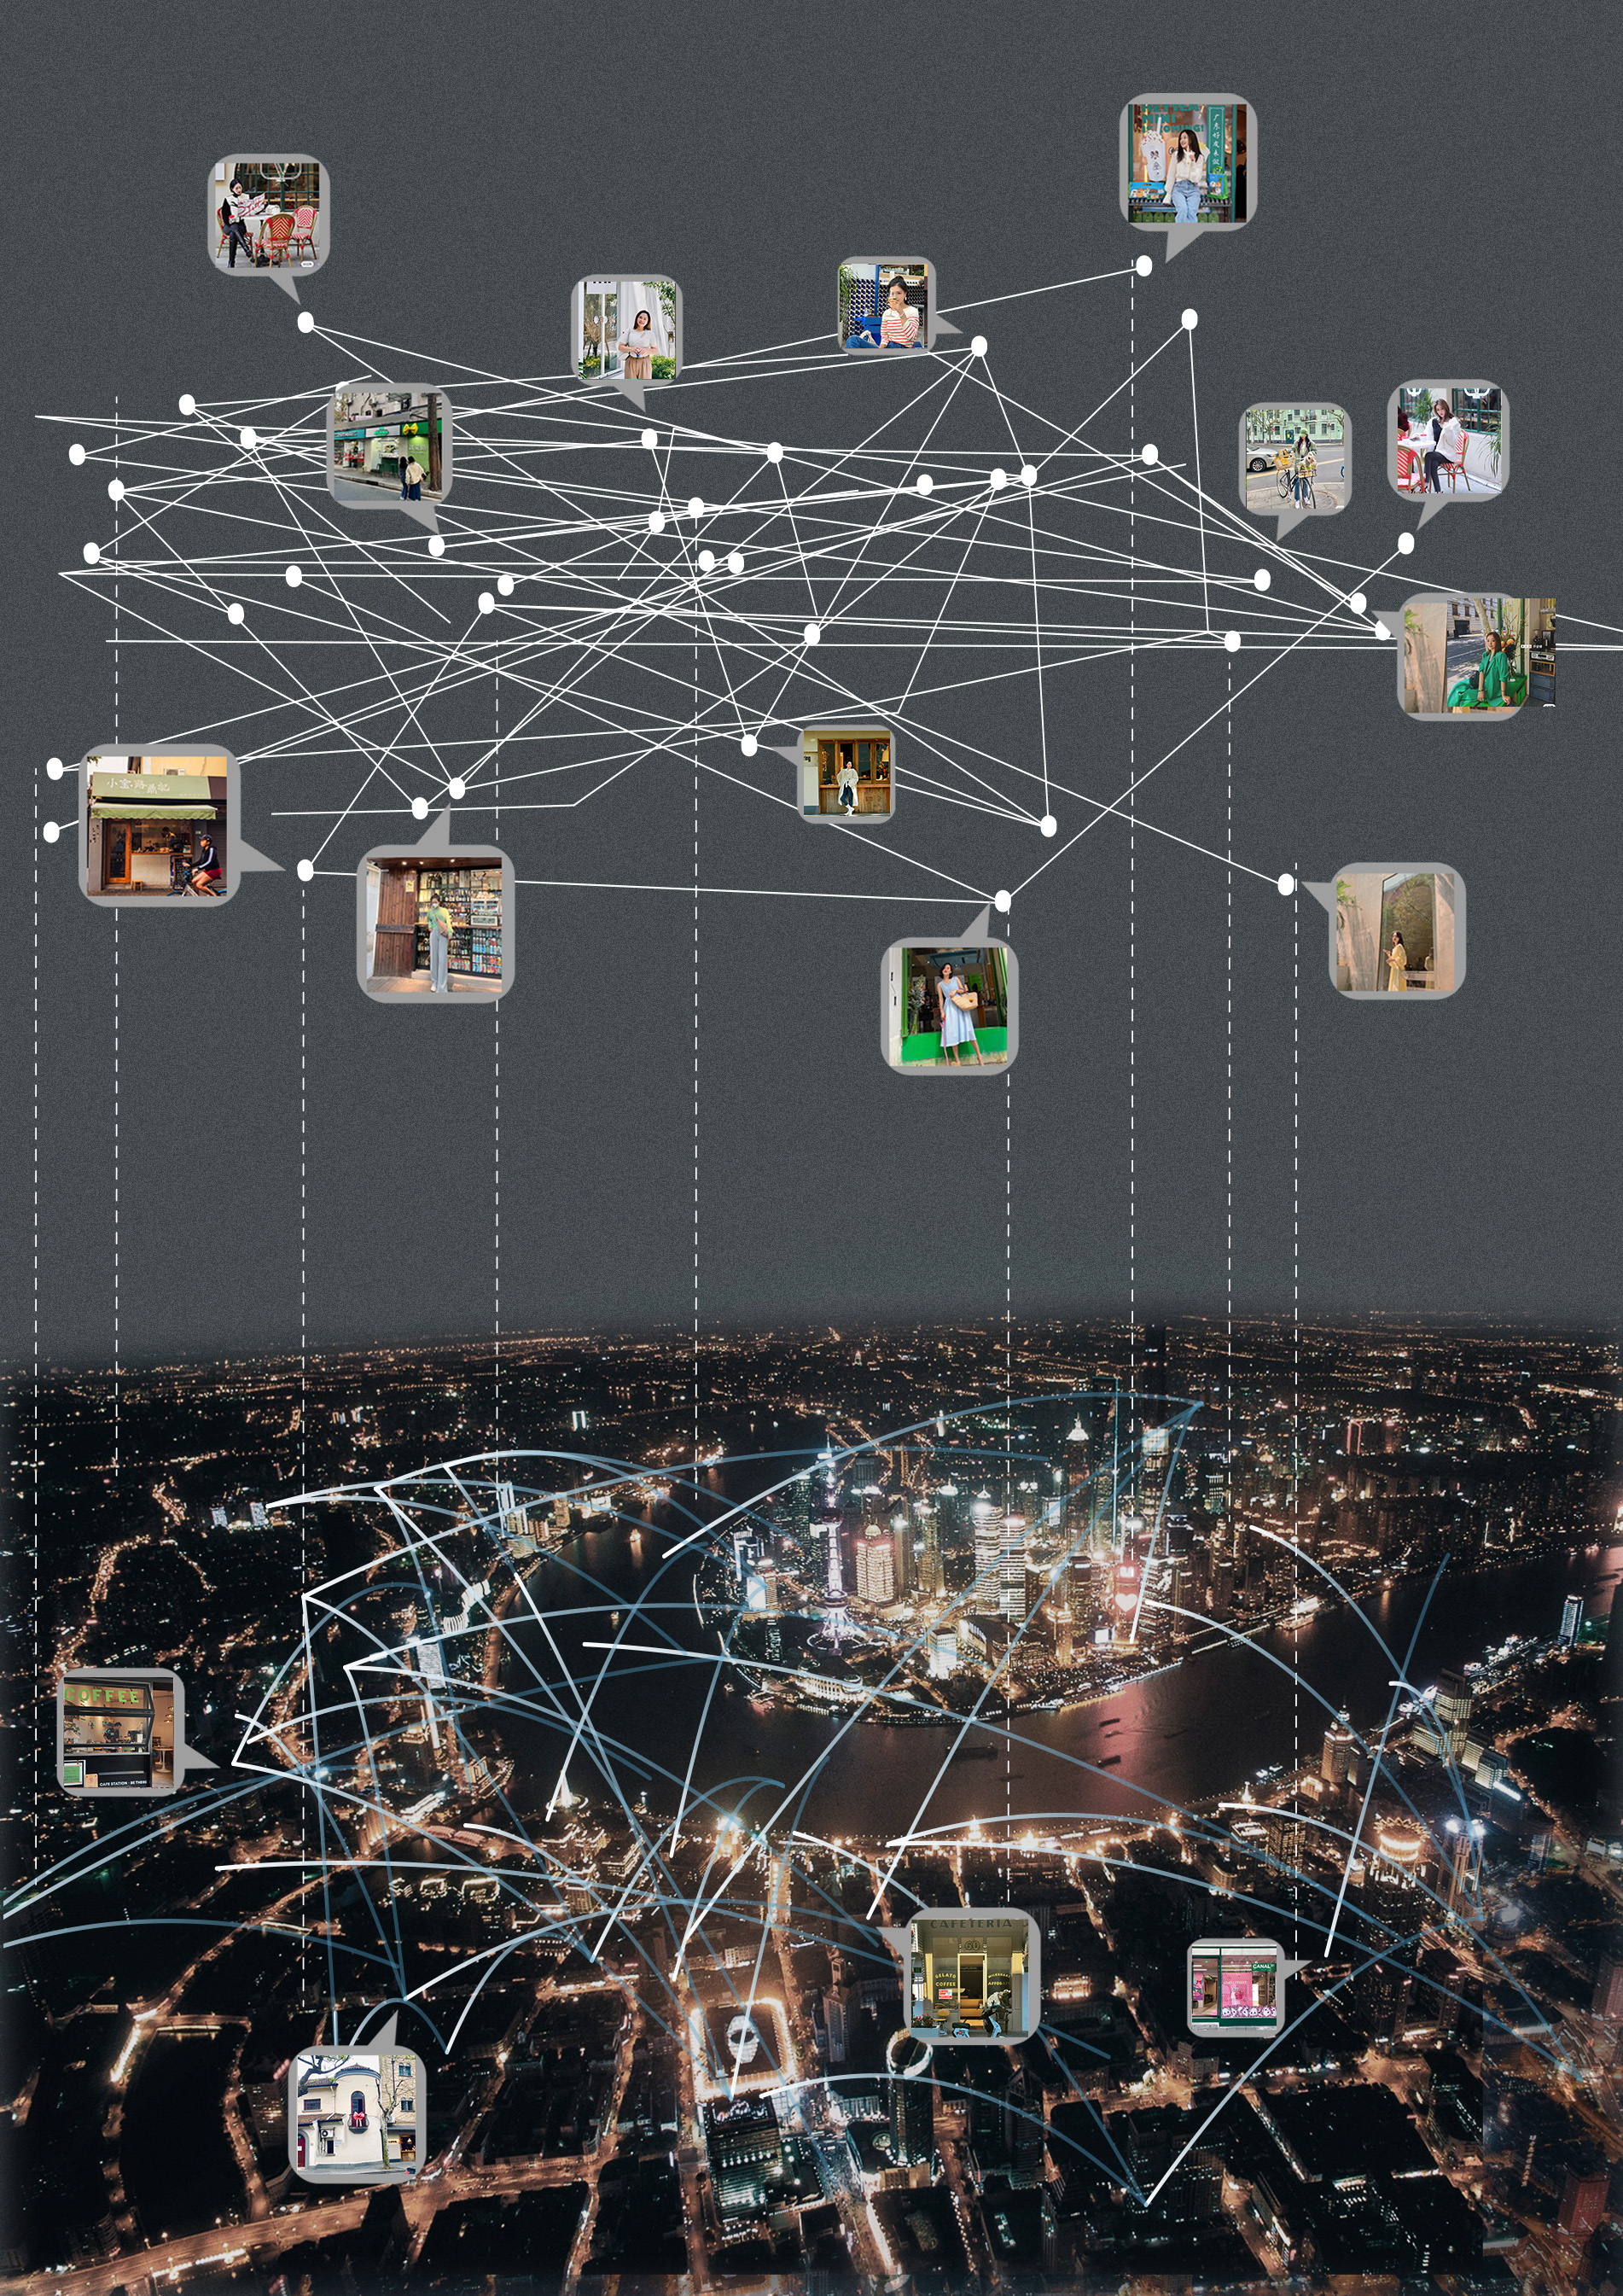
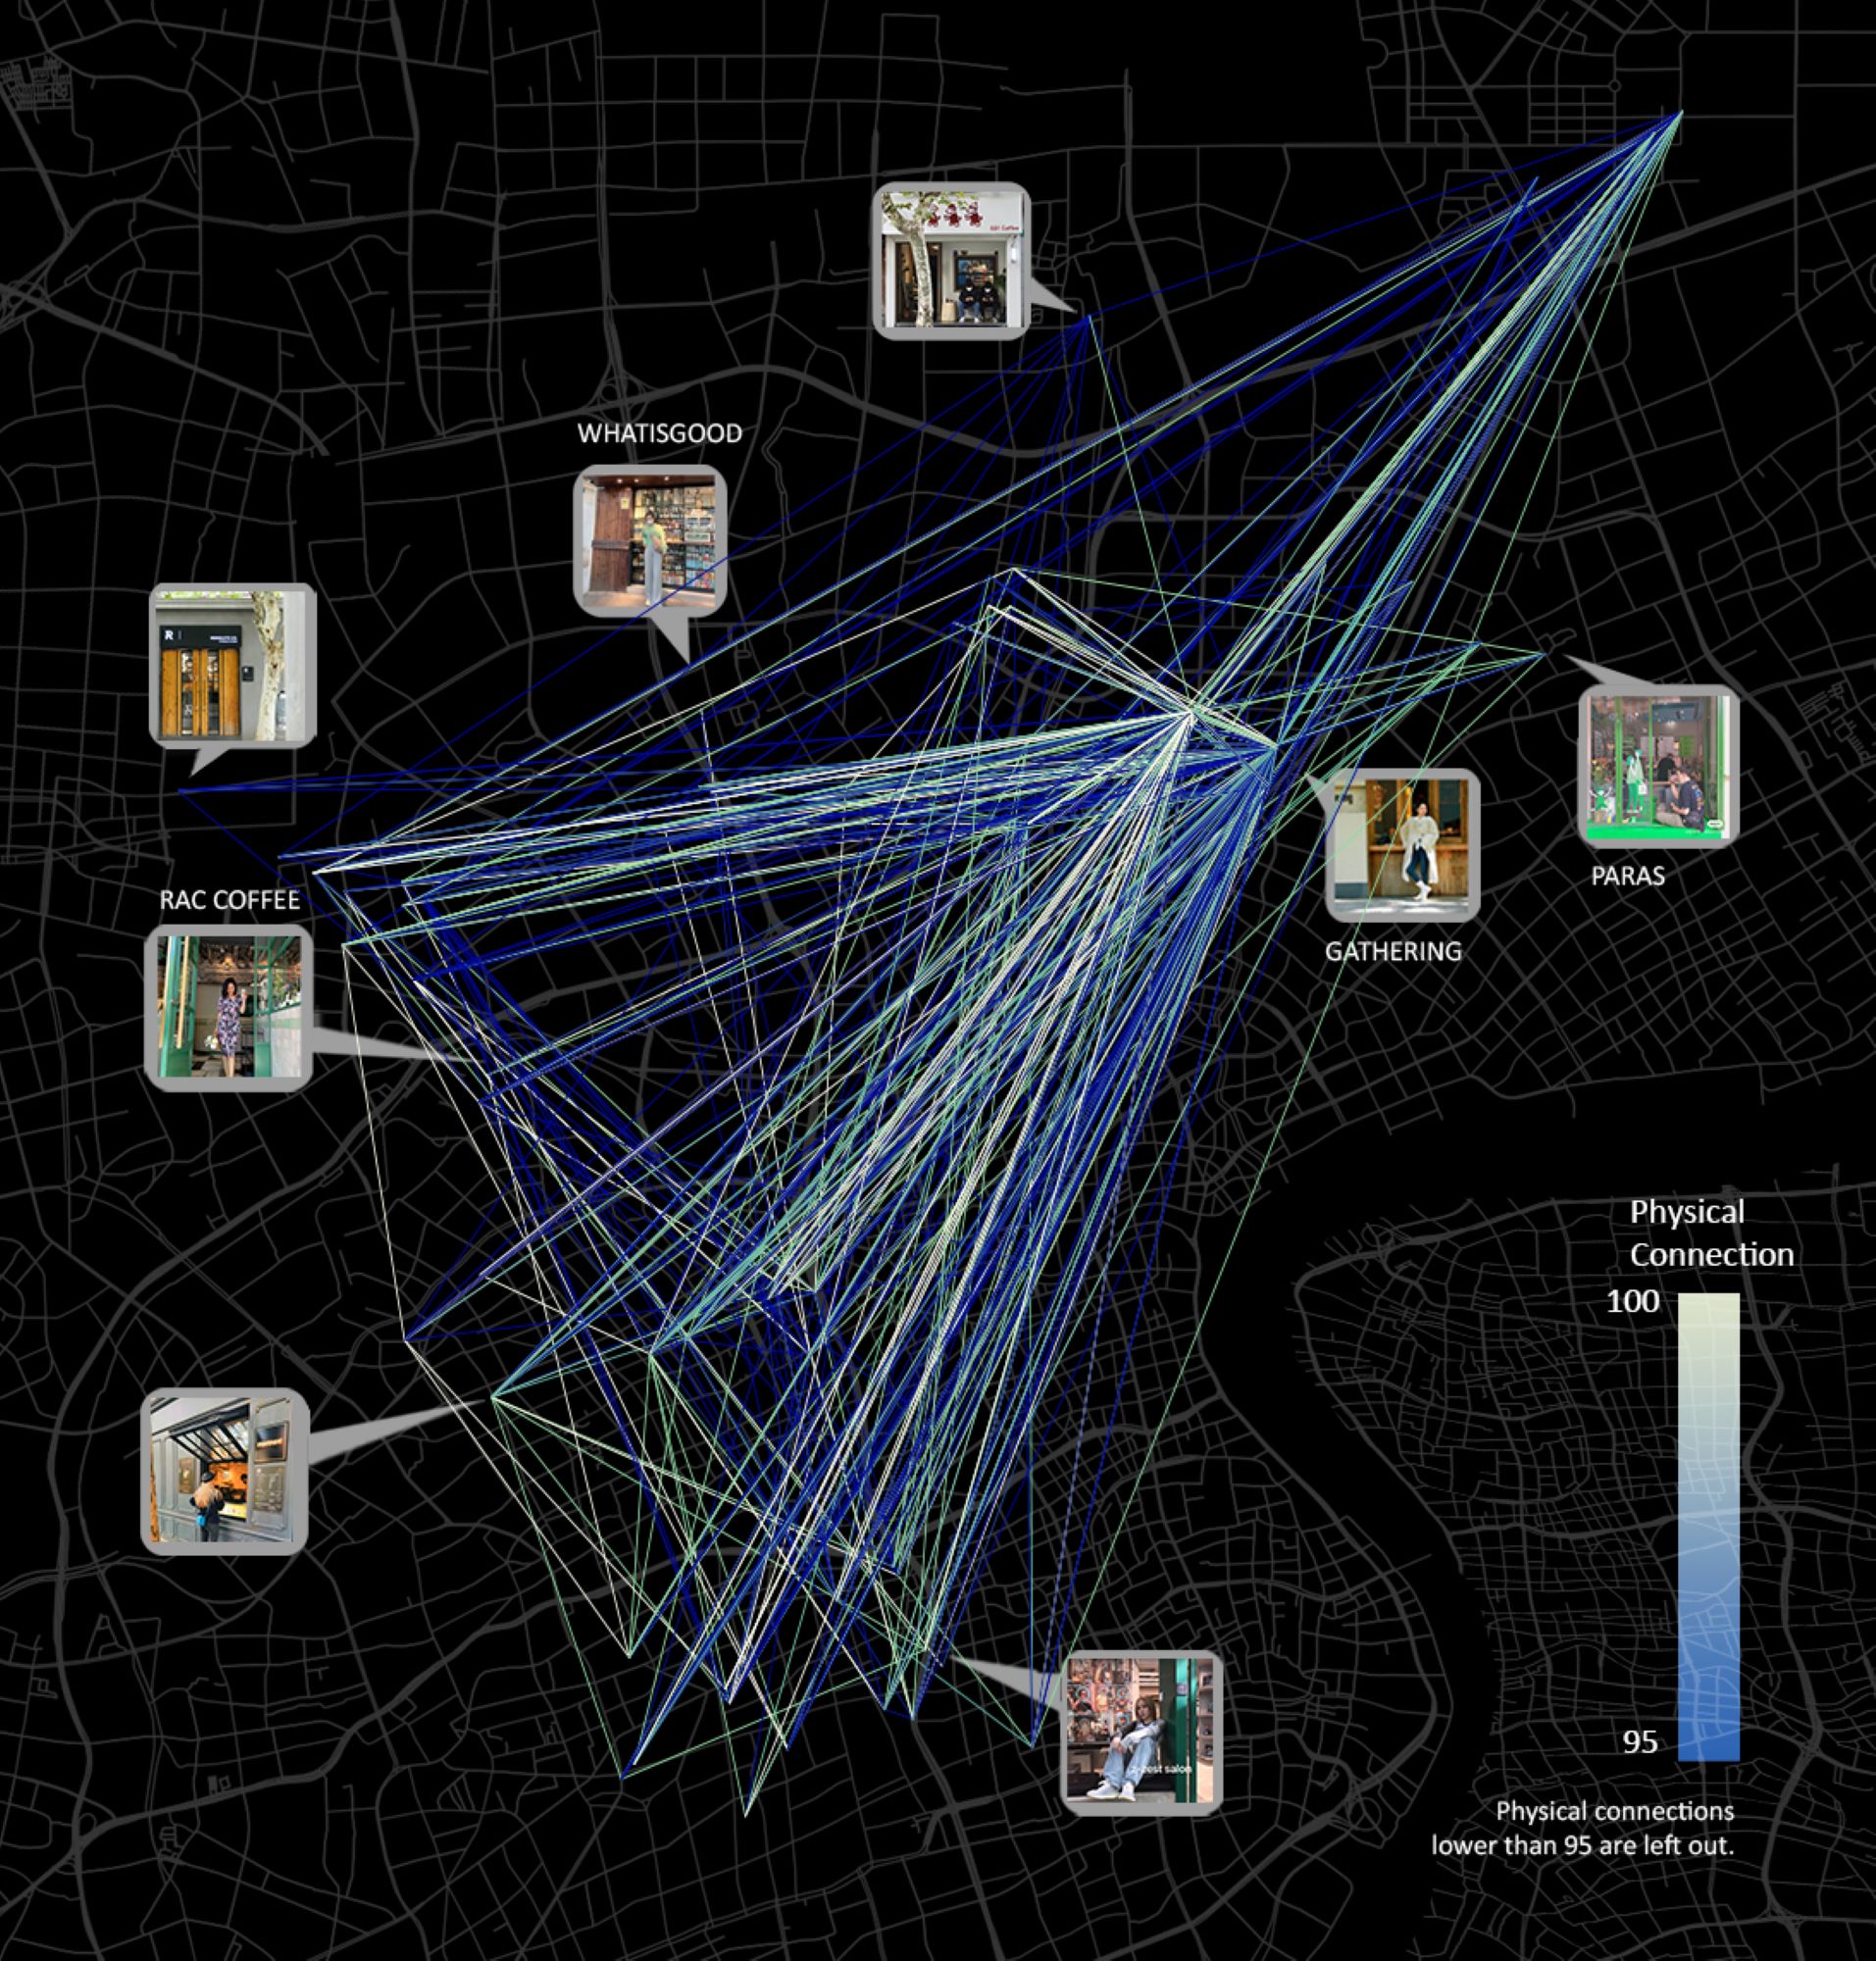
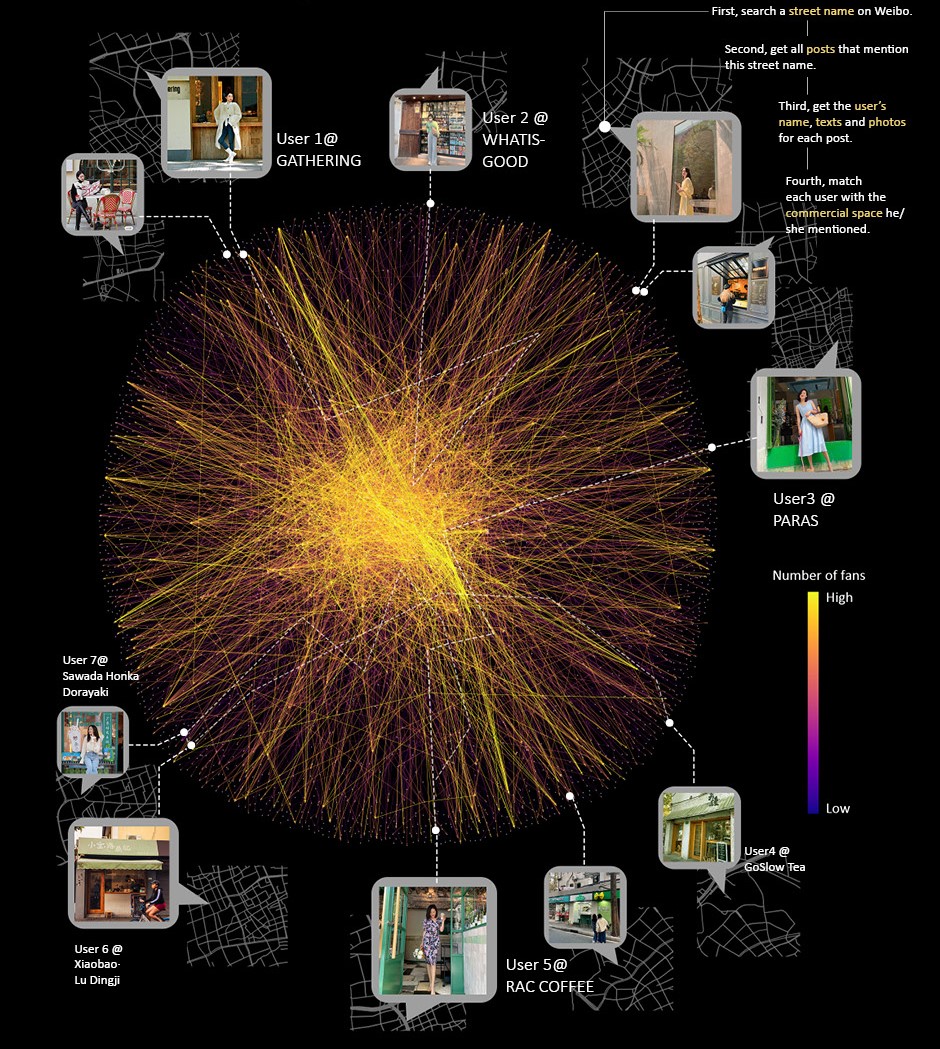
Similarity Network Visualized on Map
Each line connects one commercial space to another.
The result of the quantitative analysis is a similarity index for each pair. The higher the index, the higher the similarity. The similarities among places form a network, which is visualized on a map.
The data visualization shows that the similarities go beyond space: even commercial spaces far apart from each other are similar in architectural styles. However, whether the physical/ digital connection between two places is high or not still needs to be tested.
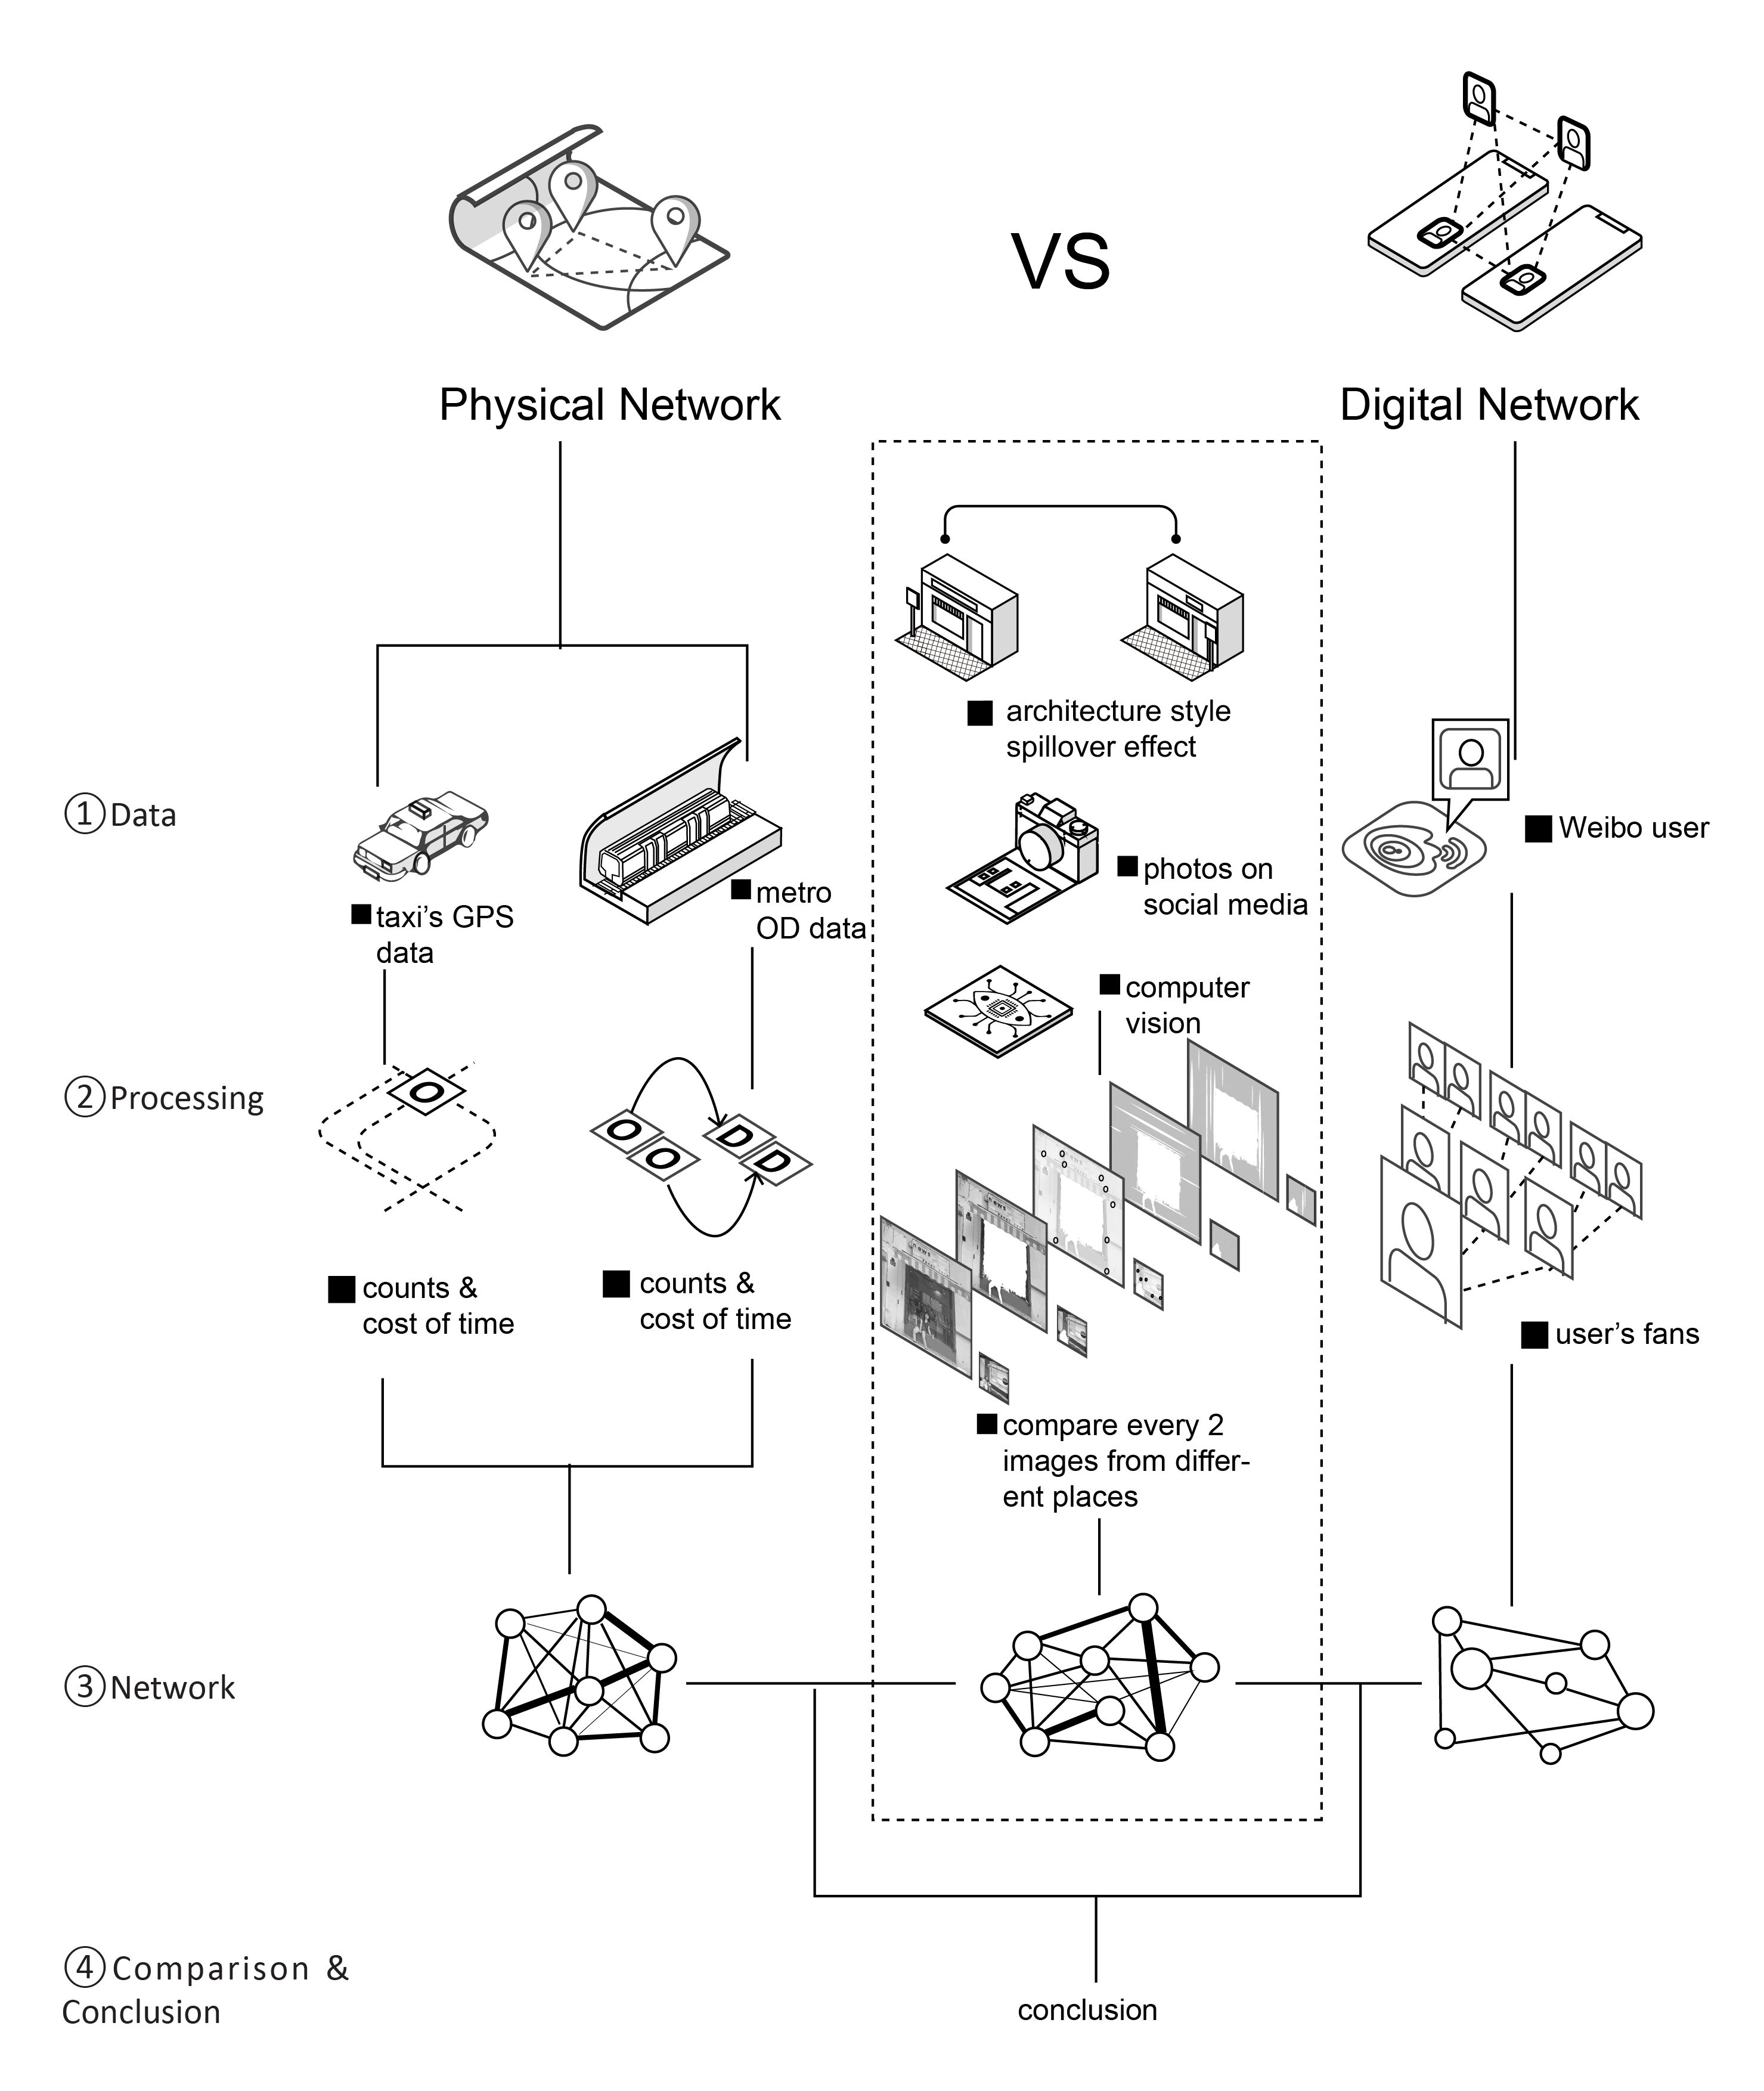
2. Physical Network
2.1 Metro Commuting Network
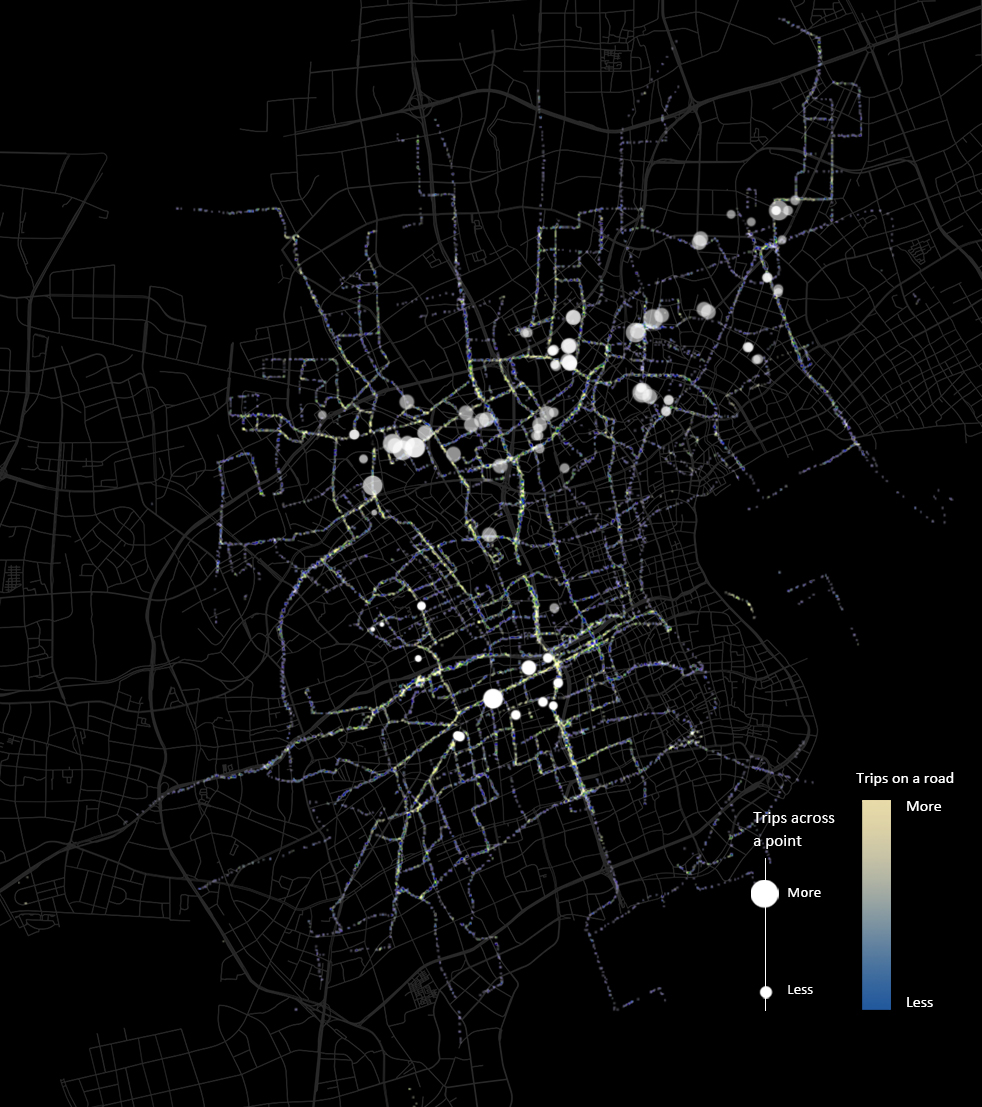
Space connection between two places can be quantified using metro passengers' trip (OD) data and its timestamp. The more passengers going from one place to another and the less time it takes, the stronger connection are established between them.
The impact of the connections between metro stations on each shop will be quantified with an Inverse Distance Weighted (IDW) method.
MetroA→B = ∑(1/TimeA→B) = ∑(1/Timemetro + DisttoStation/ Vwalk)
15,772,842 Metro OD Data in Jun, 2016
2.2 Taxi's Ride Network
Space connection between two places can also be quantified using GPS data of taxis which take passenger from one shop to another. The less time it takes to go from one place to another, the stronger connection are established between them.
TaxiA→B = ∑(1/TimeA→B) = ∑(1/Timemetro + RBuffer/ Vwalk)
2.3 Combining Metro Commuting Network and Taxi's Ride Network
ConnectionA→B = (ln(MetroA→B + TaxiA→B)- min_val) / (max_val - min_val)*100
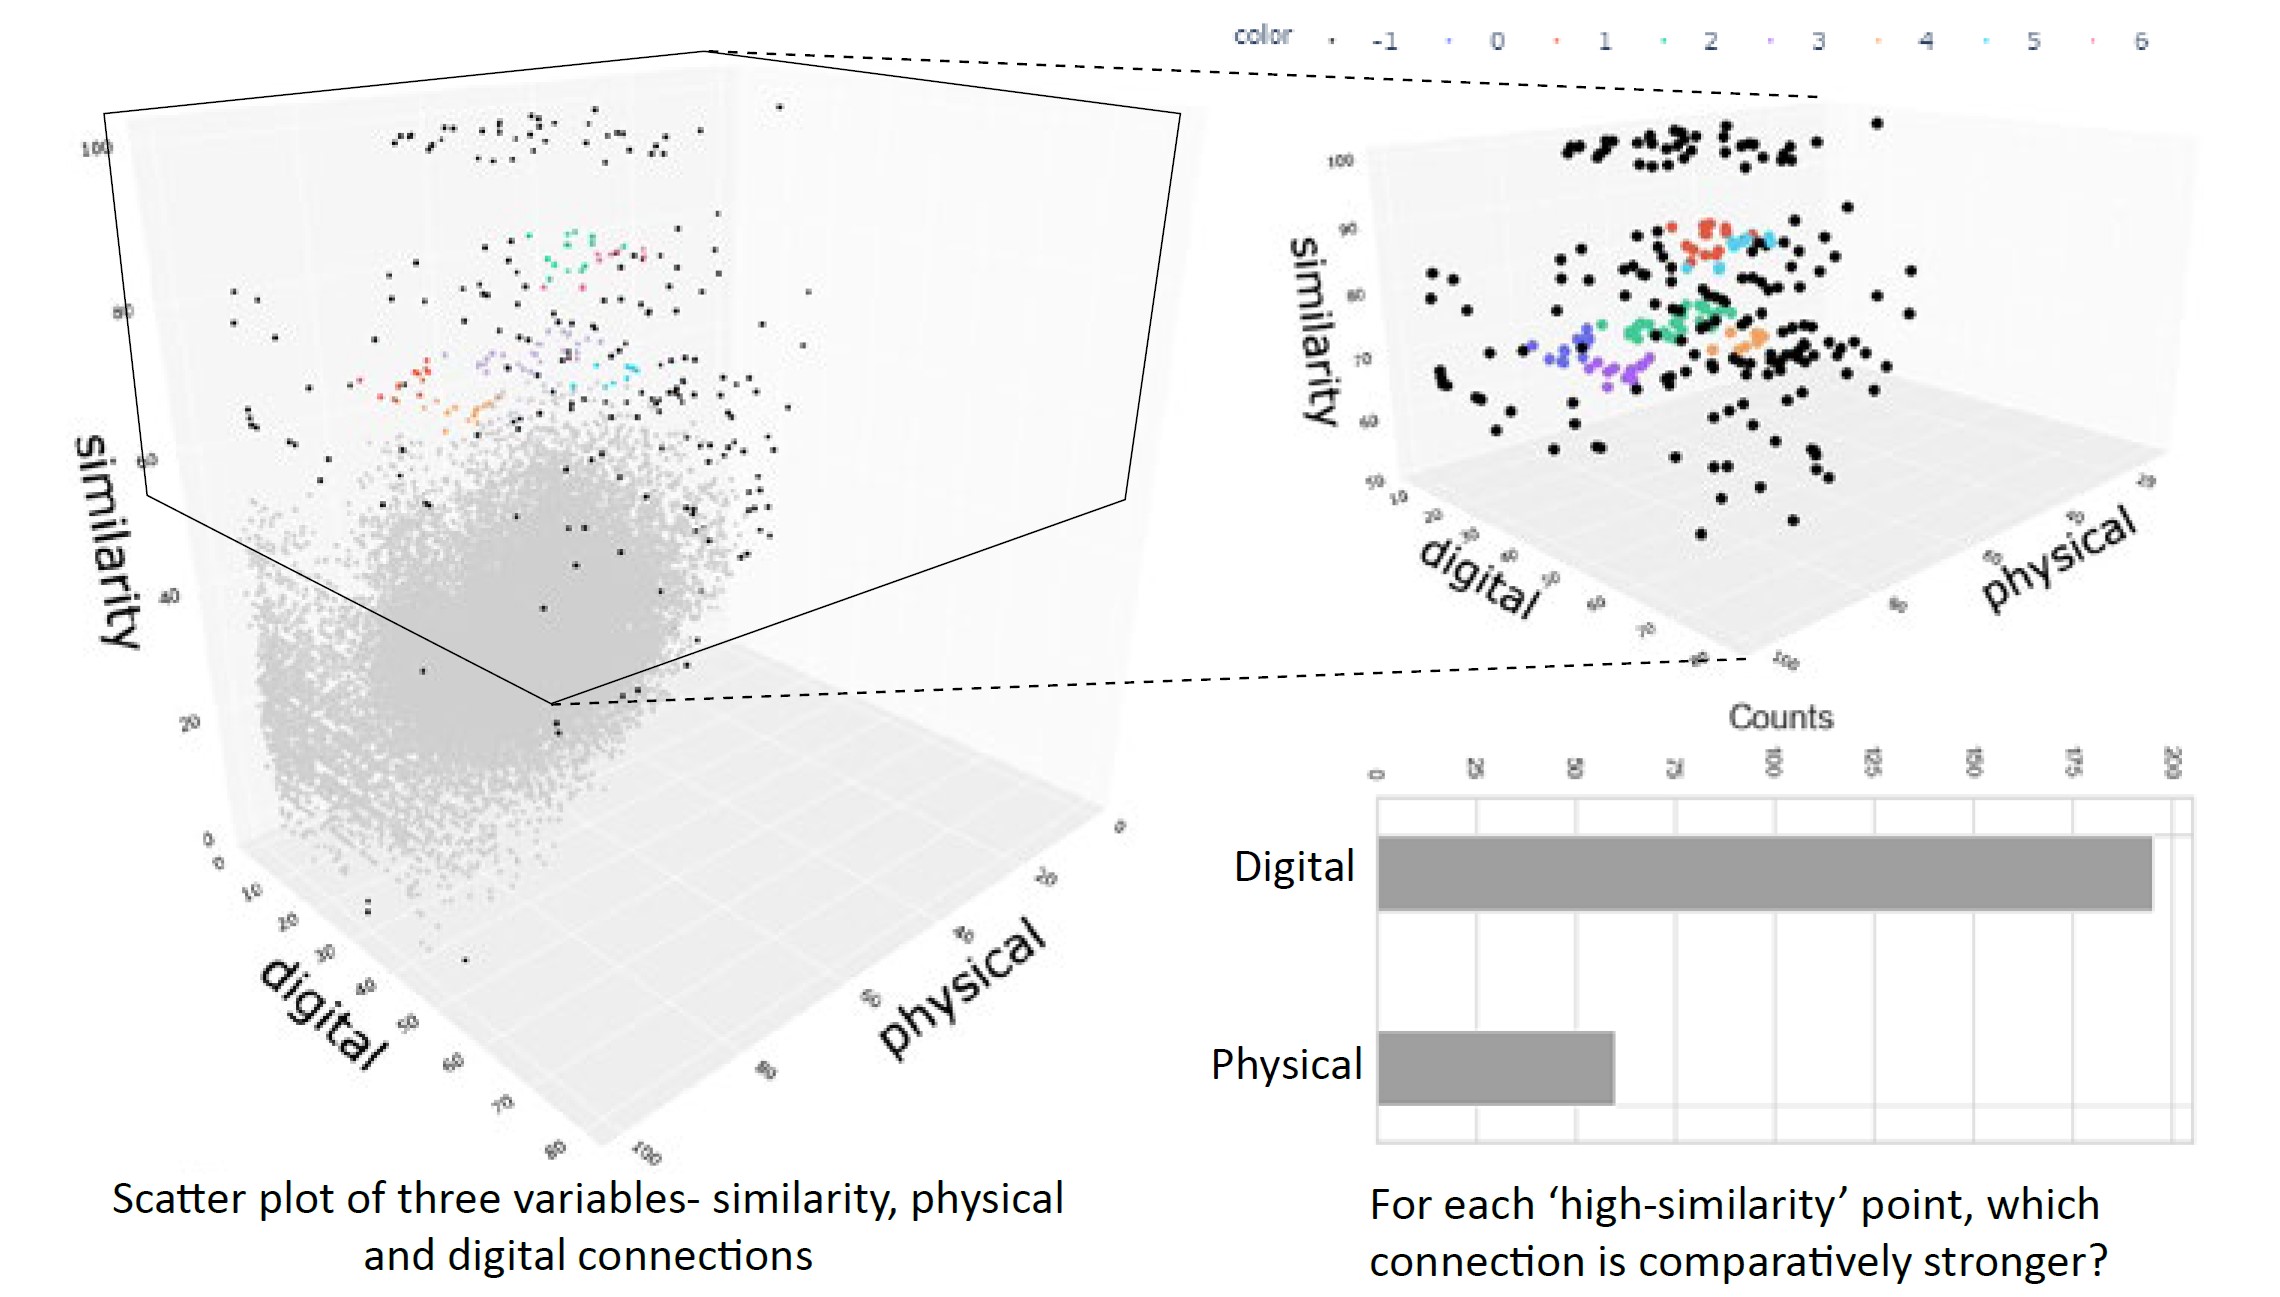
The values of normalized physical connection cluster around 0 and 100 because commercial spaces are either located on the same street or far apart. Data transformation using logarithm makes the values Gaussian-distributed, which facilitates comparisons in the next step
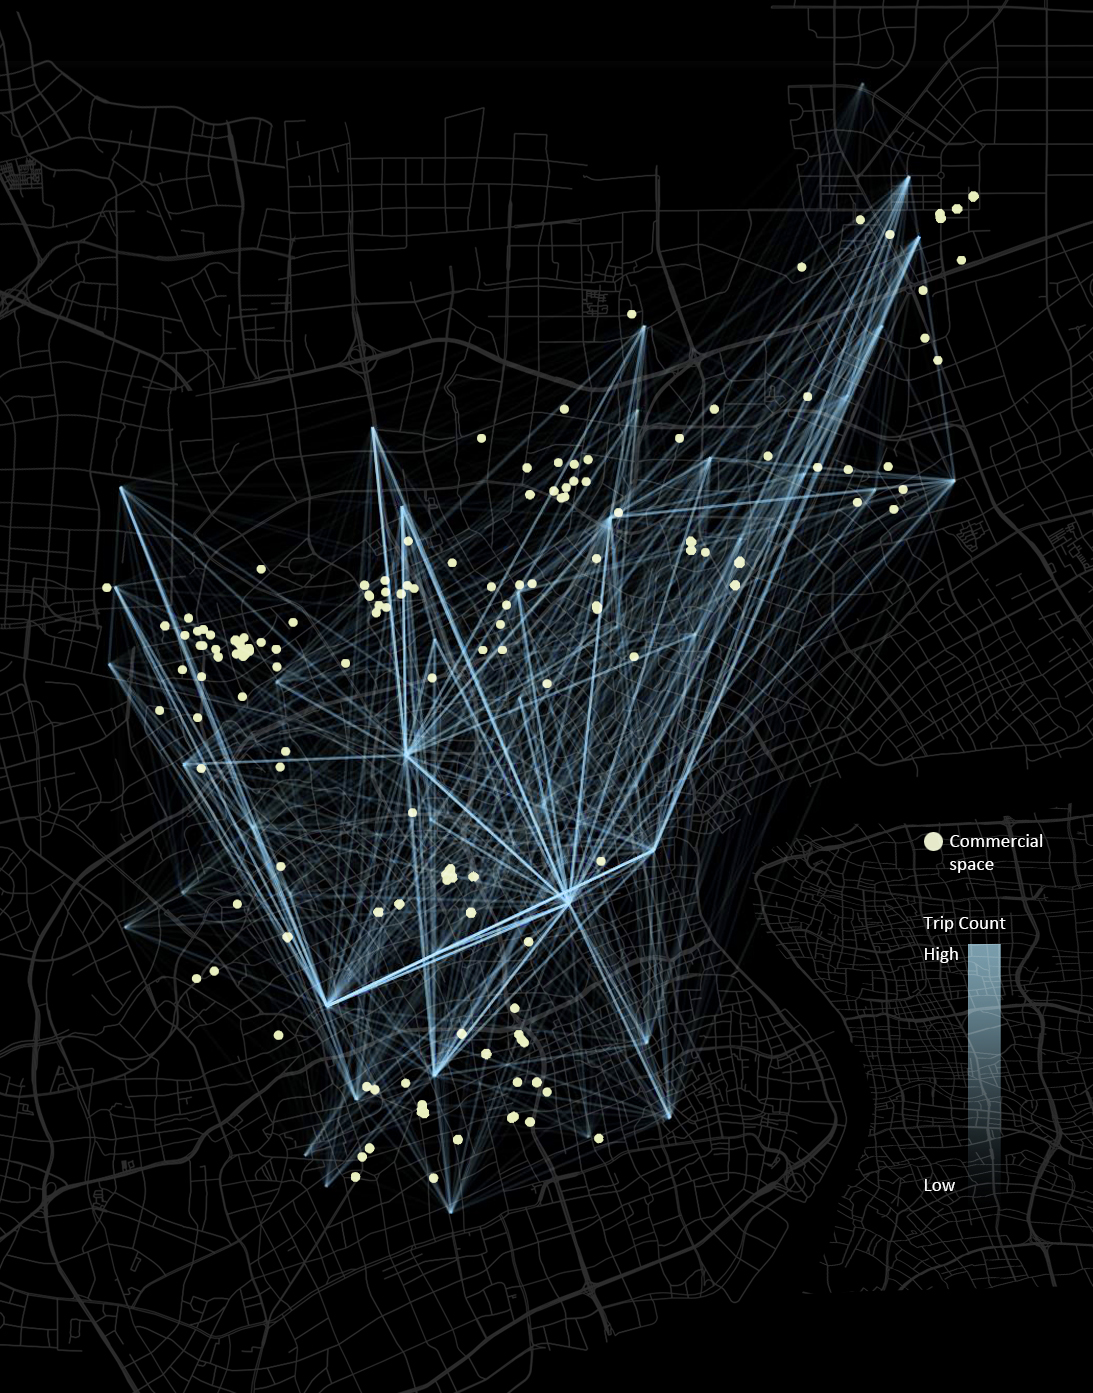
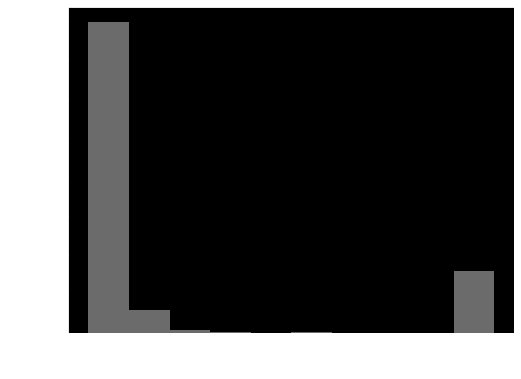
2.4 Comparing Physical Network with Similarity Network
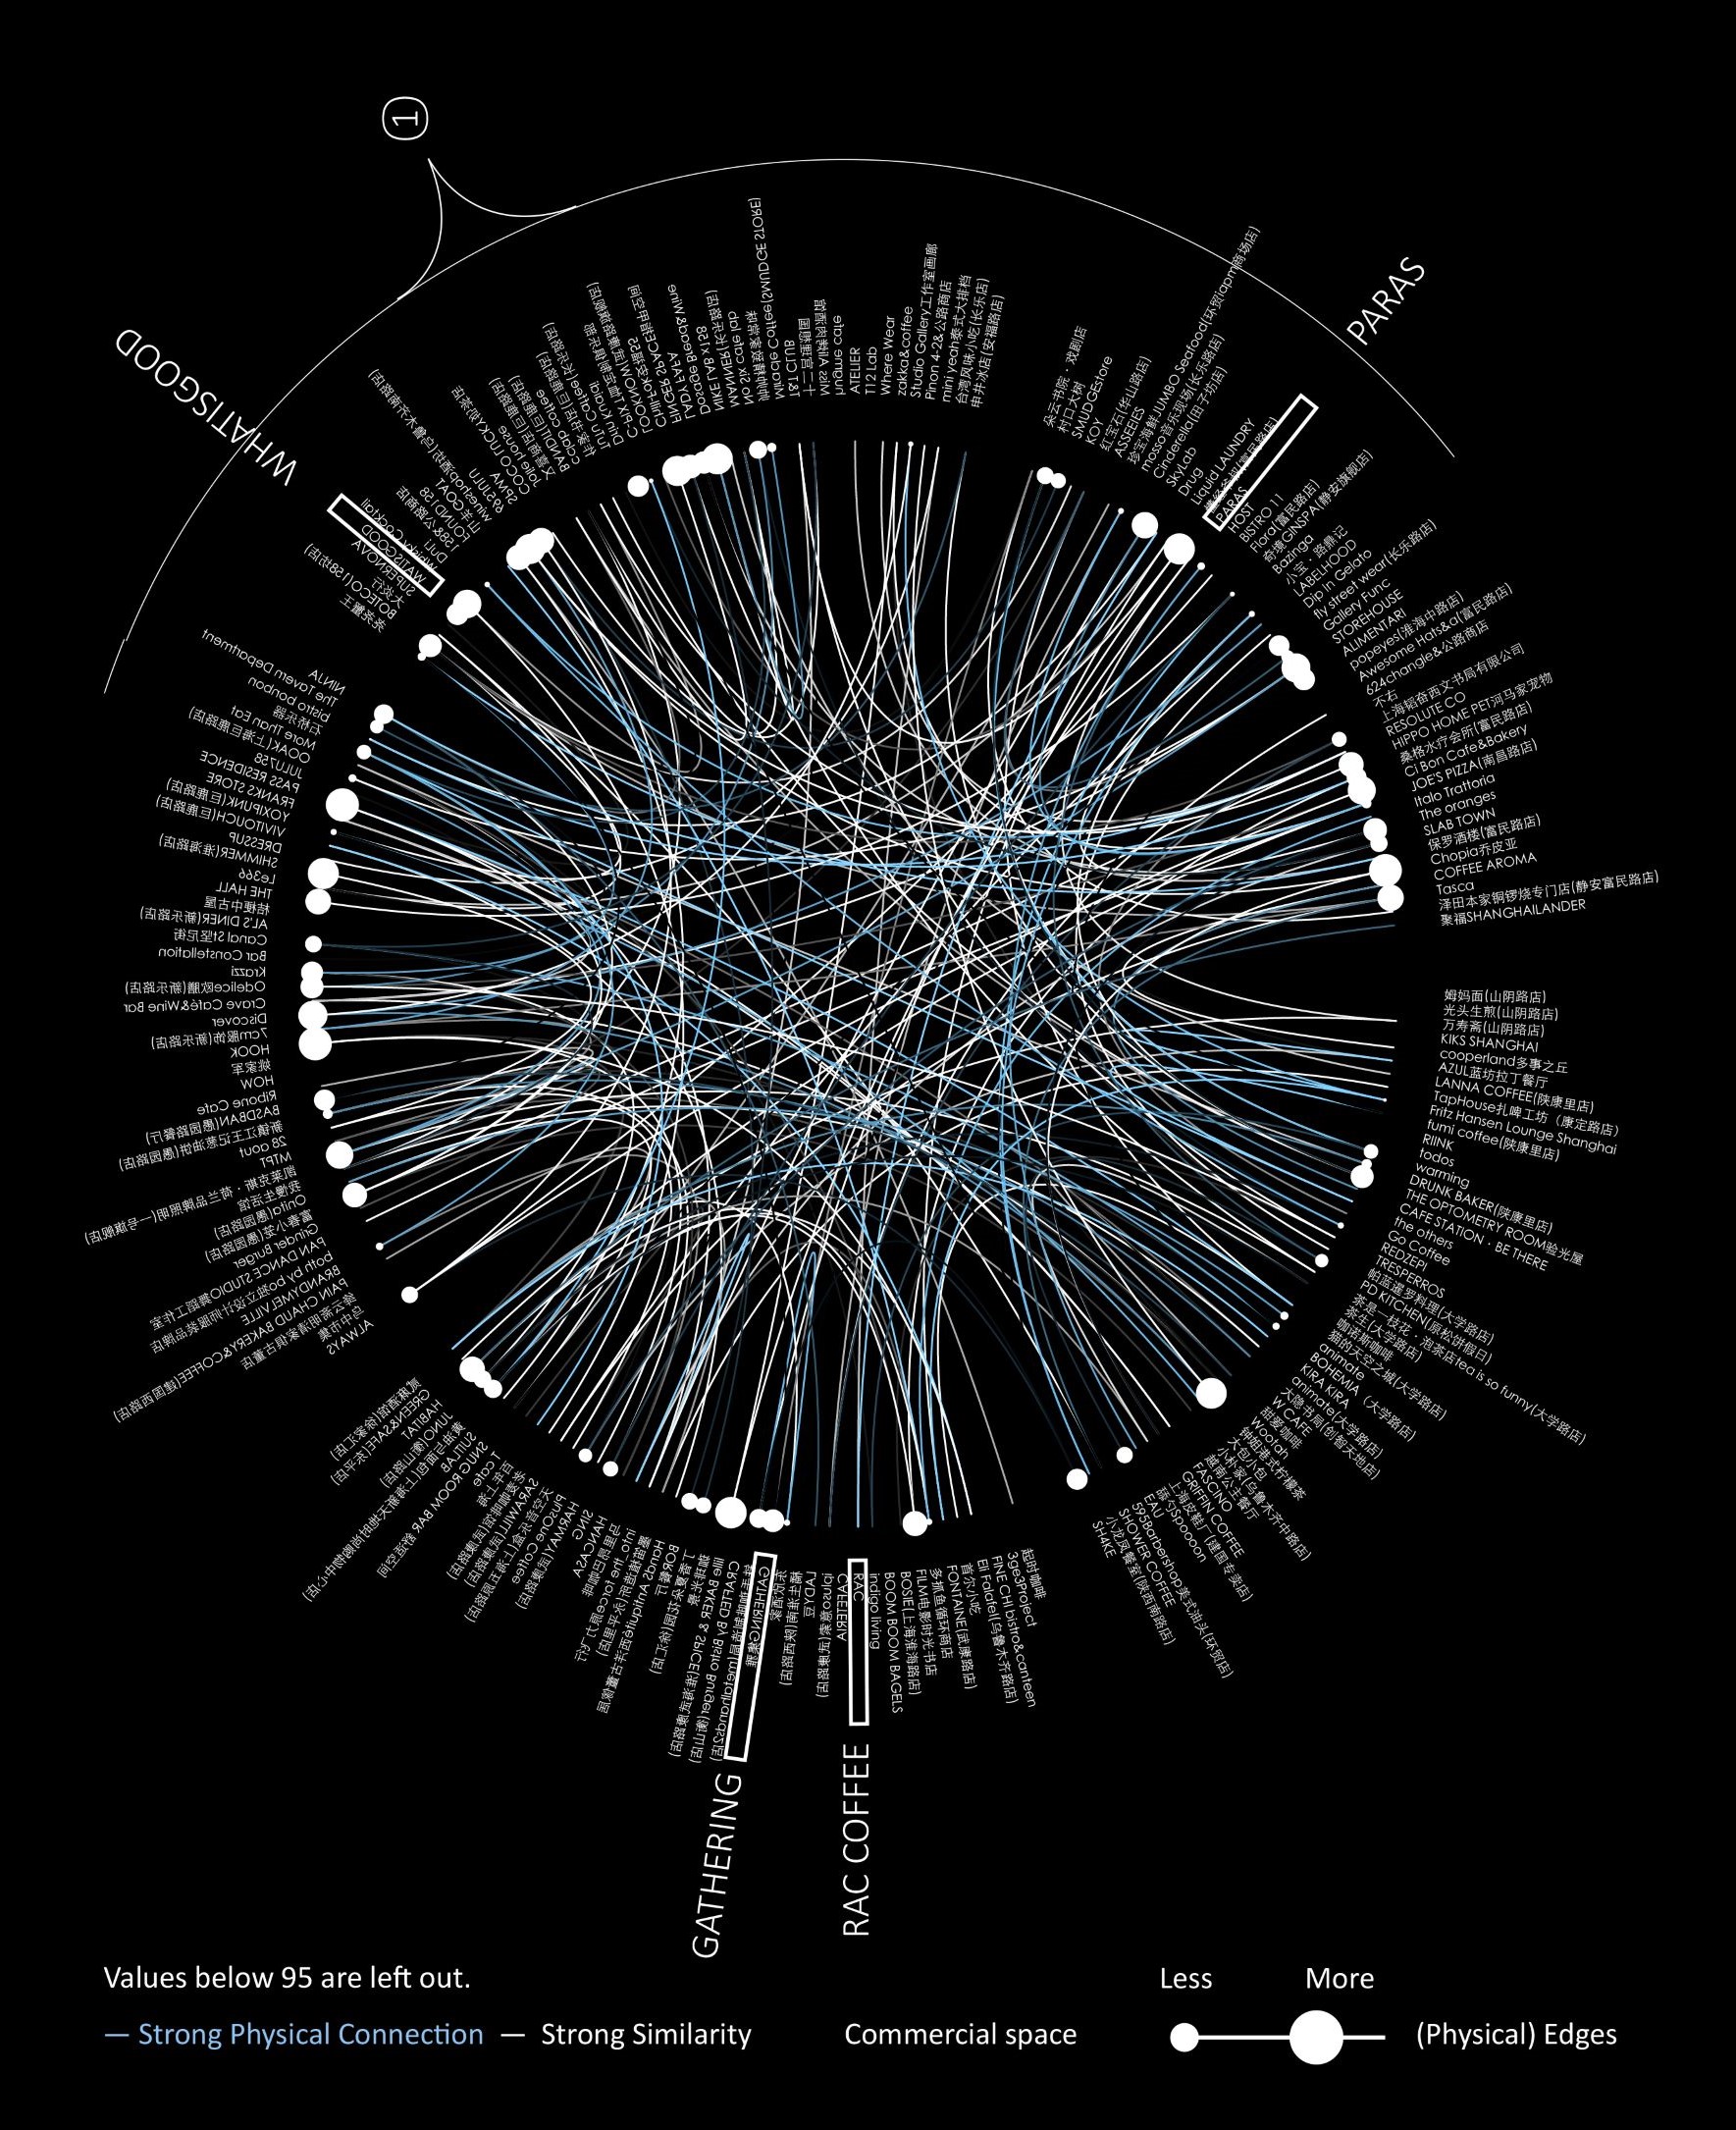
① For these commercial spaces, the similarity network looks overlapped with the physical network.
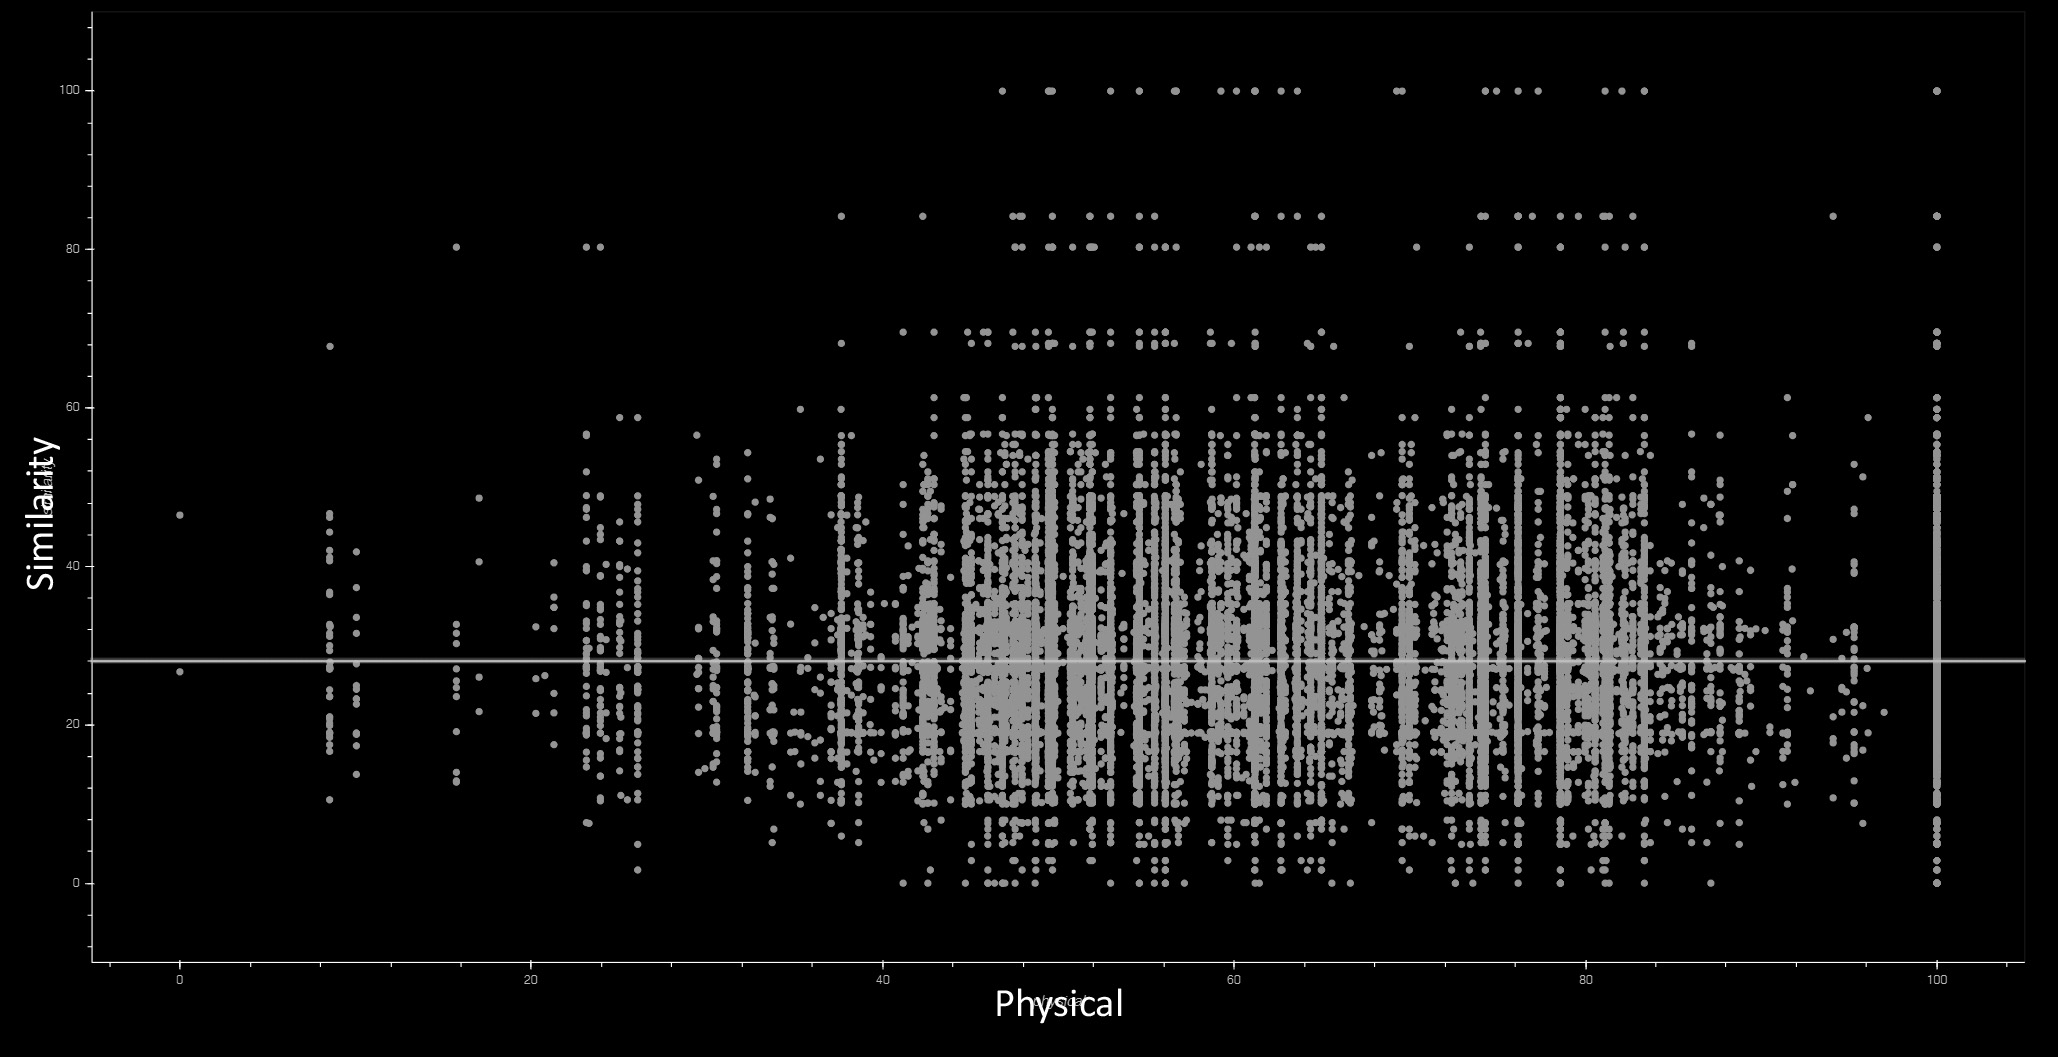
Scatter plot shows little correlation between the physical network and the similarity network.
3. Digital Network
3.1 Weibo Users' Relationships
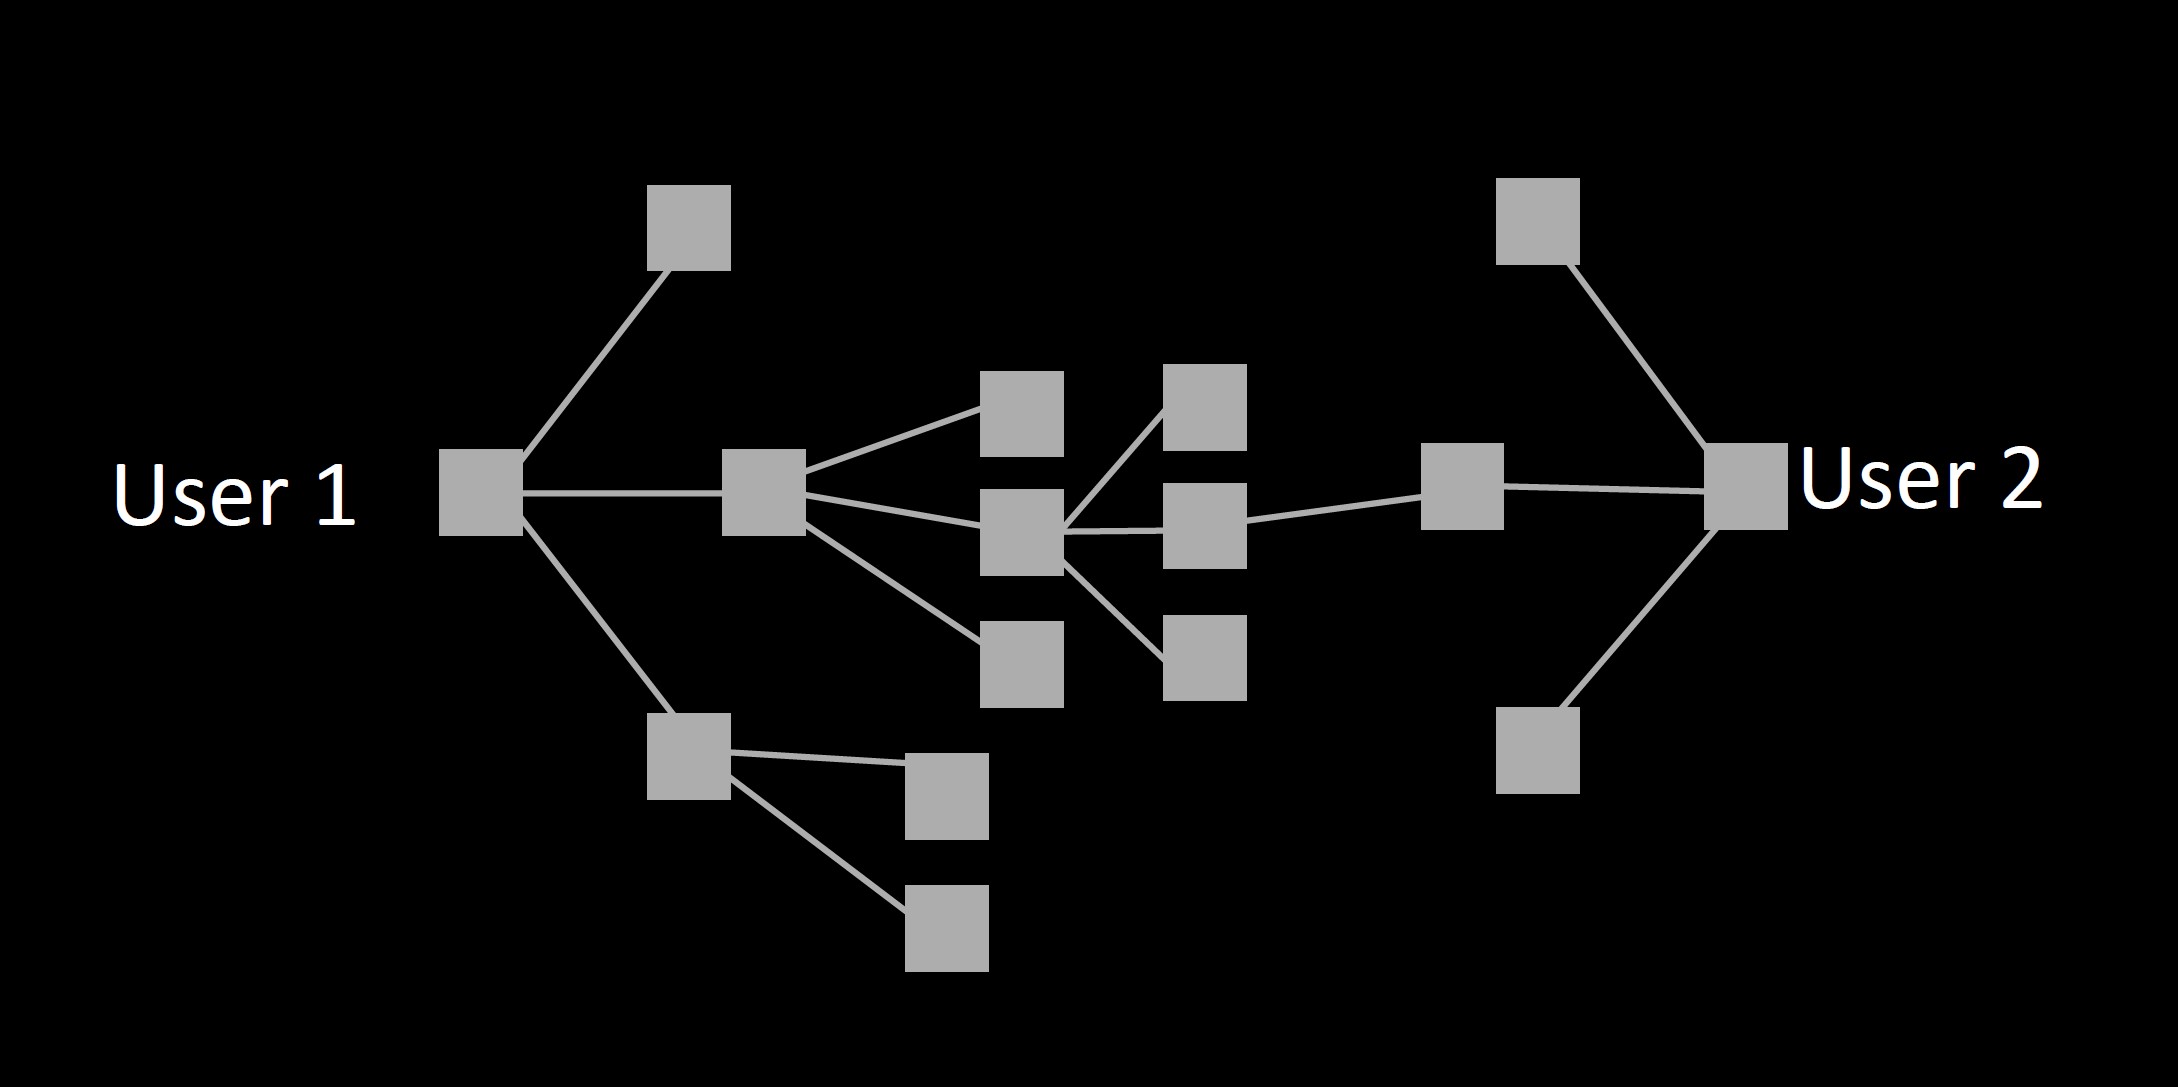
The distance of the shortest path from one specific node (user) to another will be calculated and used as an index for digital network connections. The shorter the path, the stronger the connection.
The Data was obtained through scraping Weibo user's fans ID and name.
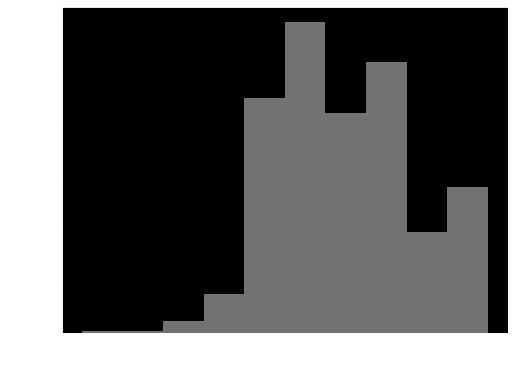
3.2 Comparing Digital Network with Similarity Network
For some of the commercial spaces, the similarity network looks overlapped with the digital network.
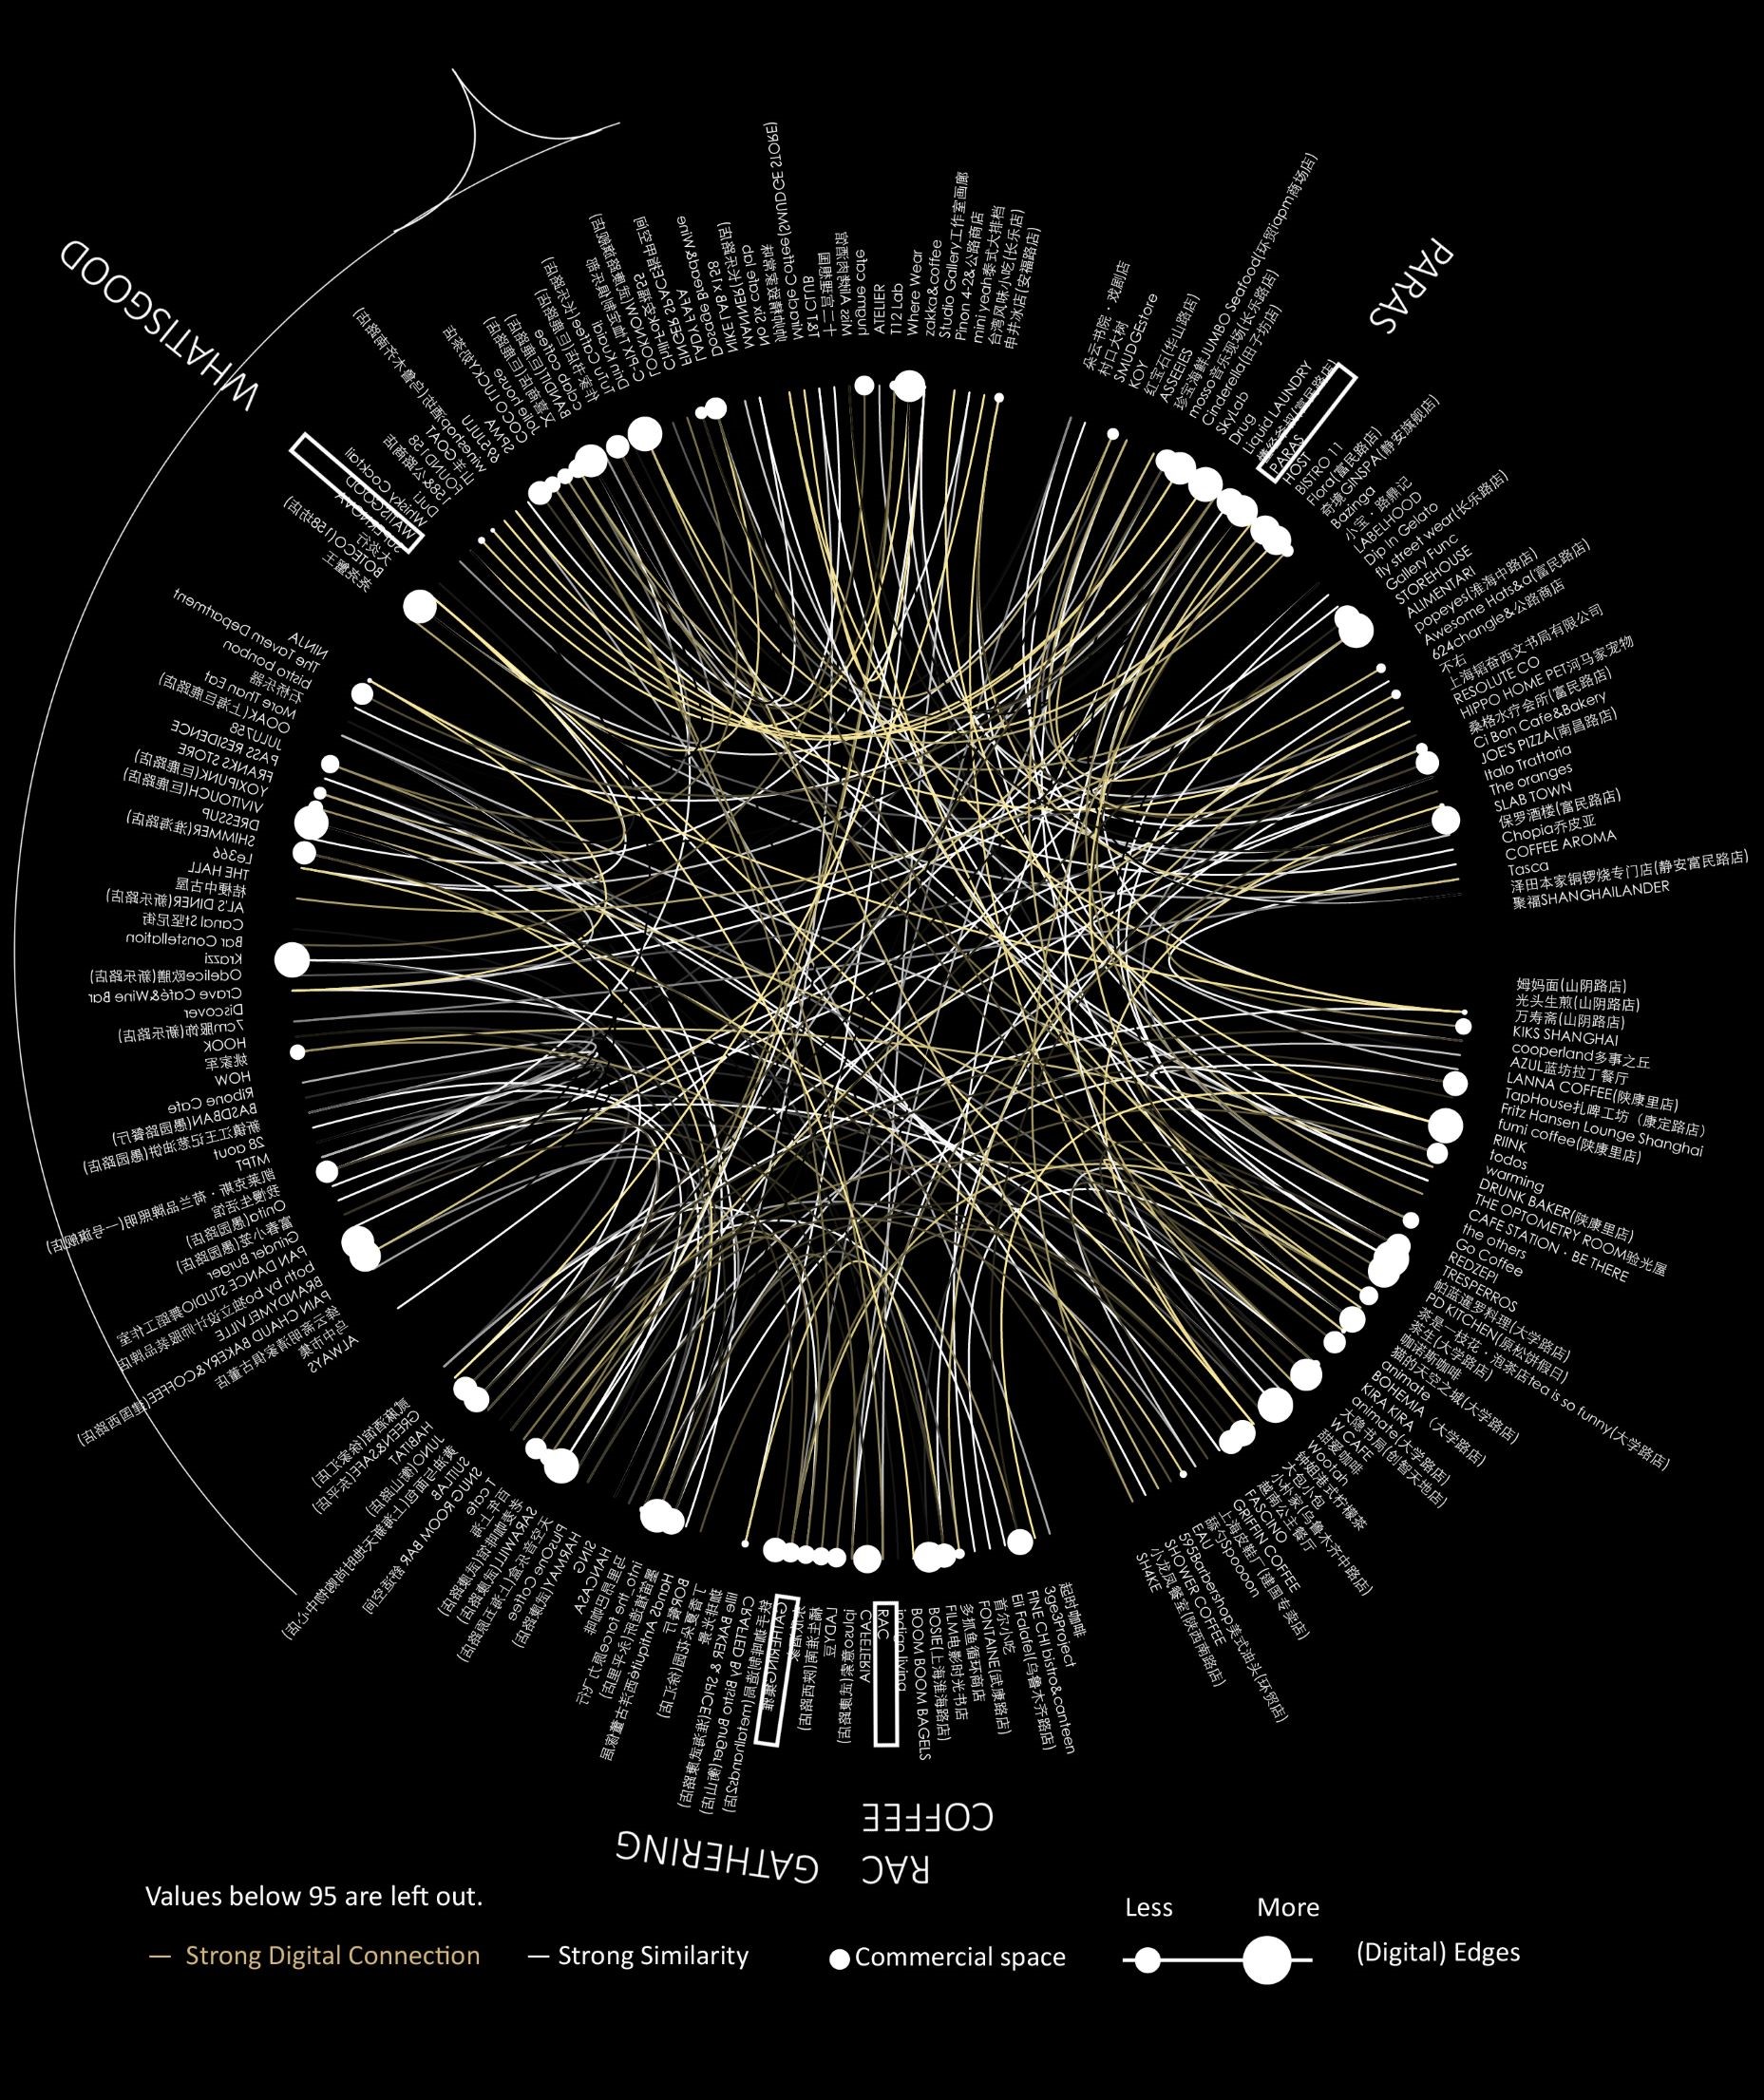

Scatter plot shows some correlation between the digital network and the similarity network.